Bulk Transcriptomics
Our OP² bulk transcriptomics pipeline is a bioinformatics analysis workflow used for bulk RNA sequencing data.
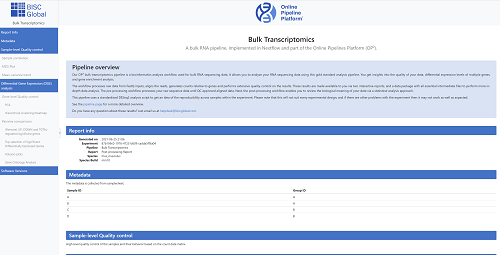
It allows you to analyze your RNA sequencing data using this gold standard analysis pipeline.
You get insights into the quality of your data, differential expression levels of multiple genes, and gene enrichment analysis.
The workflow processes raw data from FastQ inputs, aligns the reads, generates counts relative to genes and performs extensive quality-control on the results.
These results are made available to you via two interactive reports, and a data package with all essential intermediate files to perform more in-depth data analysis.
The pre-processing workflow processes your raw sequence data until QC approved aligned data.
Next, the post-processing workflow enables you to review the biological meaning of your data via a statistical analysis approach.

-
1
Input
Whole (un)stranded transcriptome data (e.g. Illumina)
Single- or paired-en compressed raw FastQ files
Reference transcriptome (hg19 or hg38 or mm10) -
2
Sequence QC
Reads with low-quality are discarded
-
3
Trimming
Adaptor and quality trimming of reads
-
4
Alignment
STAR aligns reads to reference transcriptome
-
5
Alignment QC
Alignment statistics: read depths, per base, GC content, …
-
6
Transcript quantification
Aligned reads are assigned to genomic featuresConstruction of expression matrices
-
1
Input
Load cell-gene count matrices
-
2
Produce high count matrix
Mean-variance trend
-
3
Matrix QC
Identification of low quality libraries
Low expressed genes and other summary stats -
4
Normalize data
Library size normalisation to remove technical biases
-
5
Identify highly variable features
Select most variable genes that contain useful information about the biology
Remove genes that contain noise -
6
Integrate DESeq2 objects
Format object to perform statistical analysis
-
7
Scale data
Linear transformation to give equal weights to all genes
Avoid highly-expressed gene to dominate
Shift gene expression values to cell mean of 0
Shift gene variance values to cell mean of 1 -
8
Linear dimension reduction
Principal components analysis (PCA) is performed to denoise and compact the data prior to post-processing.
-
9
Determine dimensionality
Select components based on the Elbow Plot
-
10
Cluster samples
Construct K-Nearest neighbor graph on Euclidean distance in PCA space
Refine by Jaccard similarity
Cluster samples by modularity optimization Louvain algorithms -
11
Identify differential expressed genes
Comparative analyses is performed on the differences induced by stimulation/treatment.
We take the average expression of all clusters and generate the scatter plots, highlighting genes that are identified in previous step. -
12
Gene ontology
Check over-representations of genes or gene products across conditions.